
Cortex — Network Monitoring System
Cortex turns network alarms into clear answers: which customer services are affected, who owns the fix, and proof the job was done. It brings NOC, service desk, inventory and reporting into one platform.
How Cortex works
A view of how work moves through Cortex.
Trace a network alarm to service impact
In this fictional example, a failed network device produces several alarms. The NOC needs to know which fault to work first and which services may be affected.
Group related alarms
Review correlated alarms together and use the network view to investigate the likely fault.
Check service impact
Follow the device-to-service relationships to identify potentially affected services and customers.
Assign and close the incident
Give the incident an owner, track the response, and retain the evidence used to close it.
Product screens
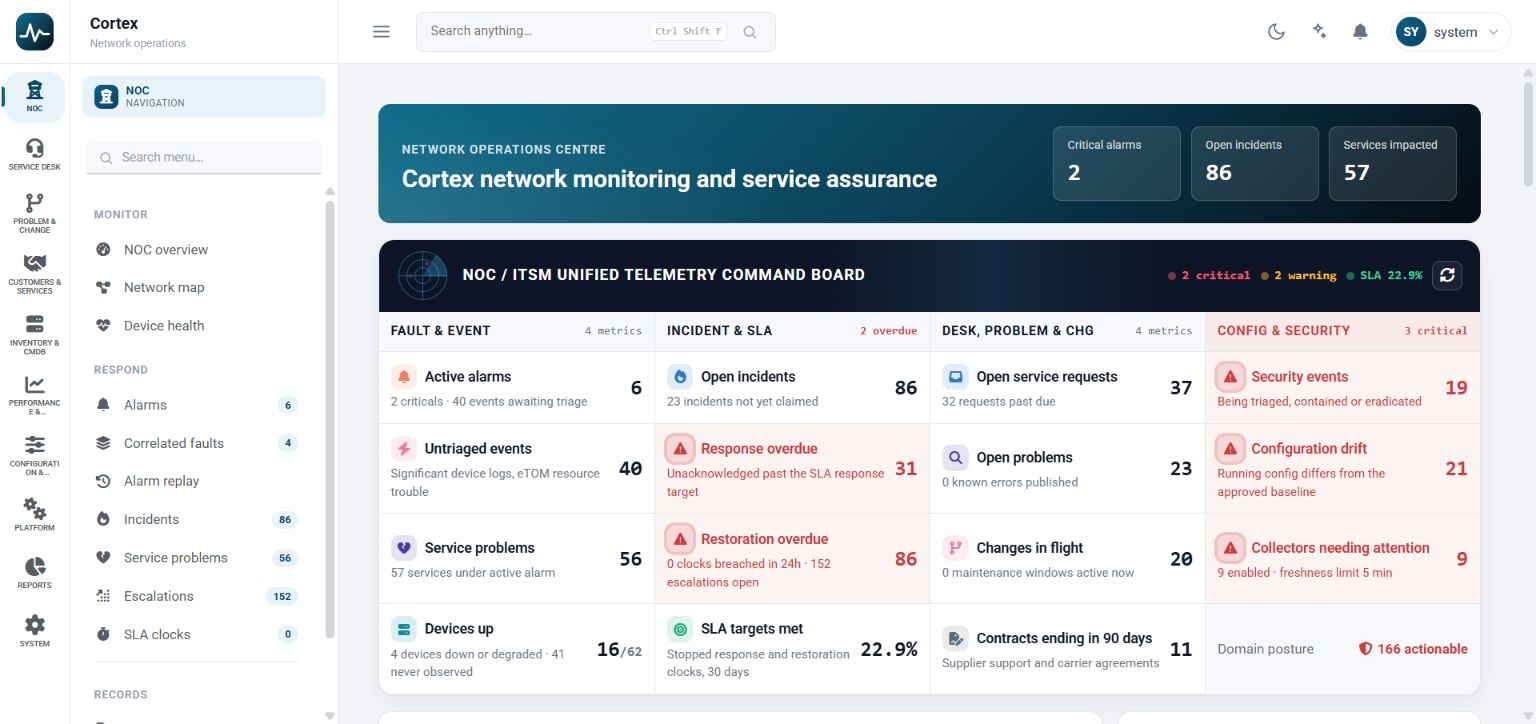
Review alarms, incidents, service impact and SLA deadlines from one board.
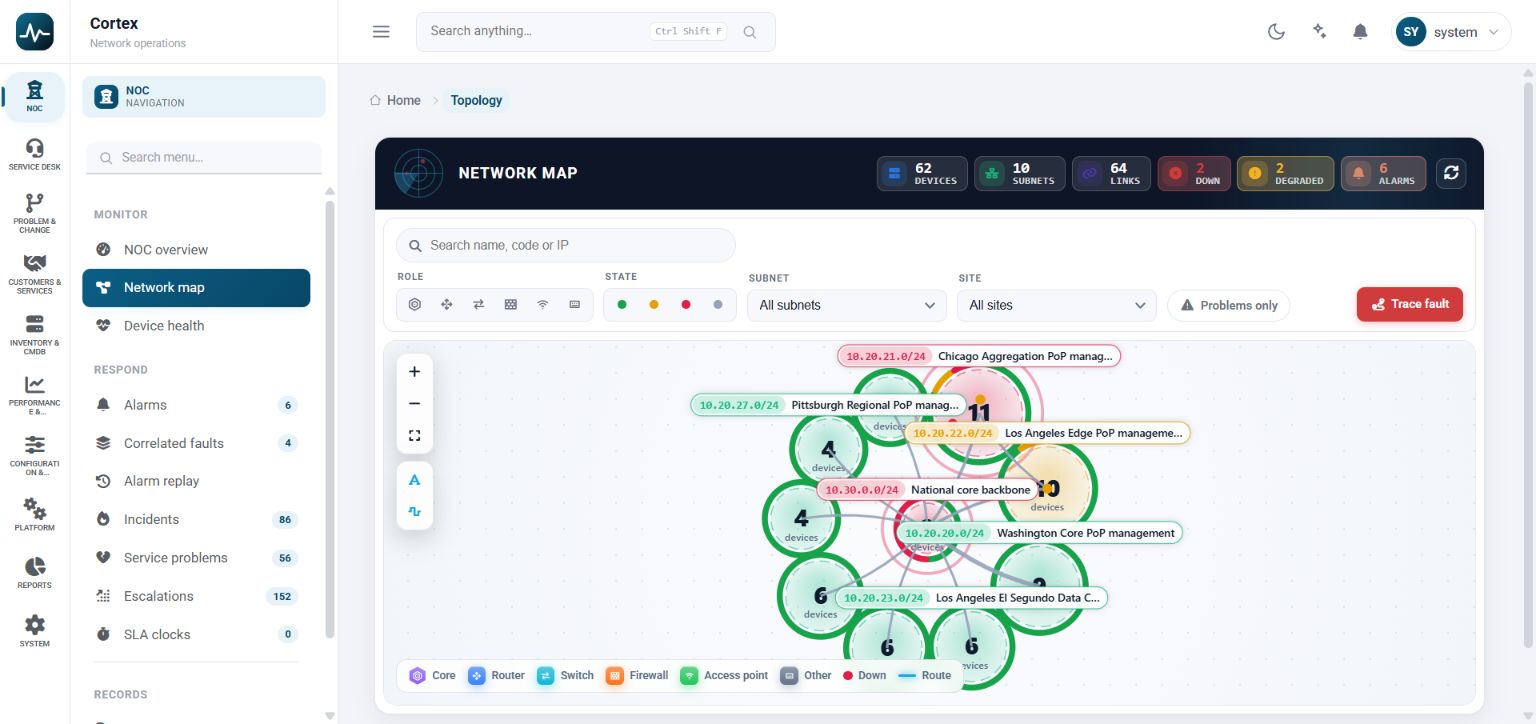
Filter the network by device role, health, subnet or site to investigate faults.
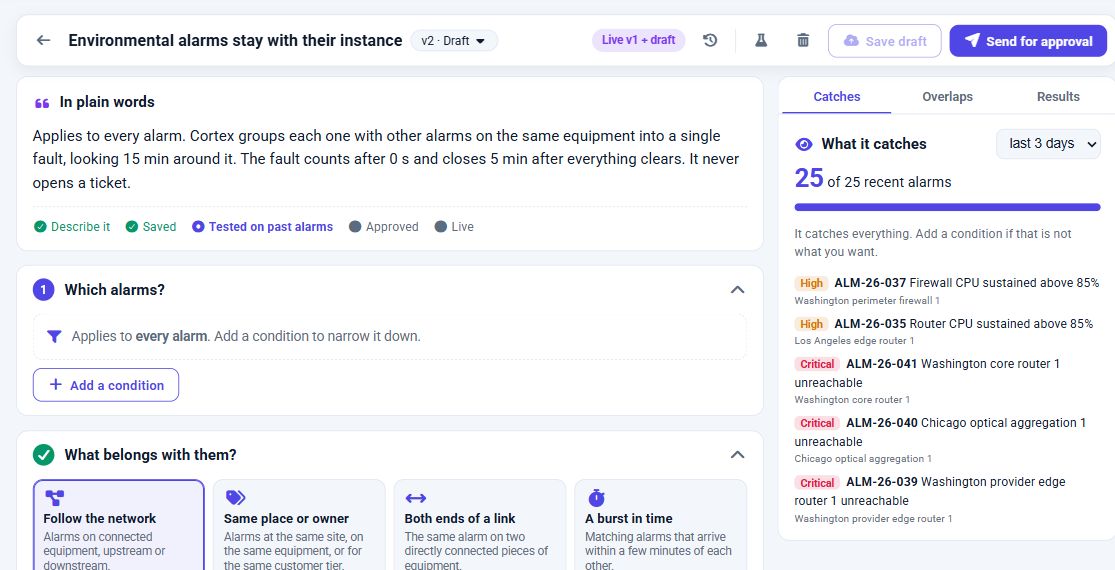
Read an alarm correlation policy in plain language and see which recent alarms it catches.
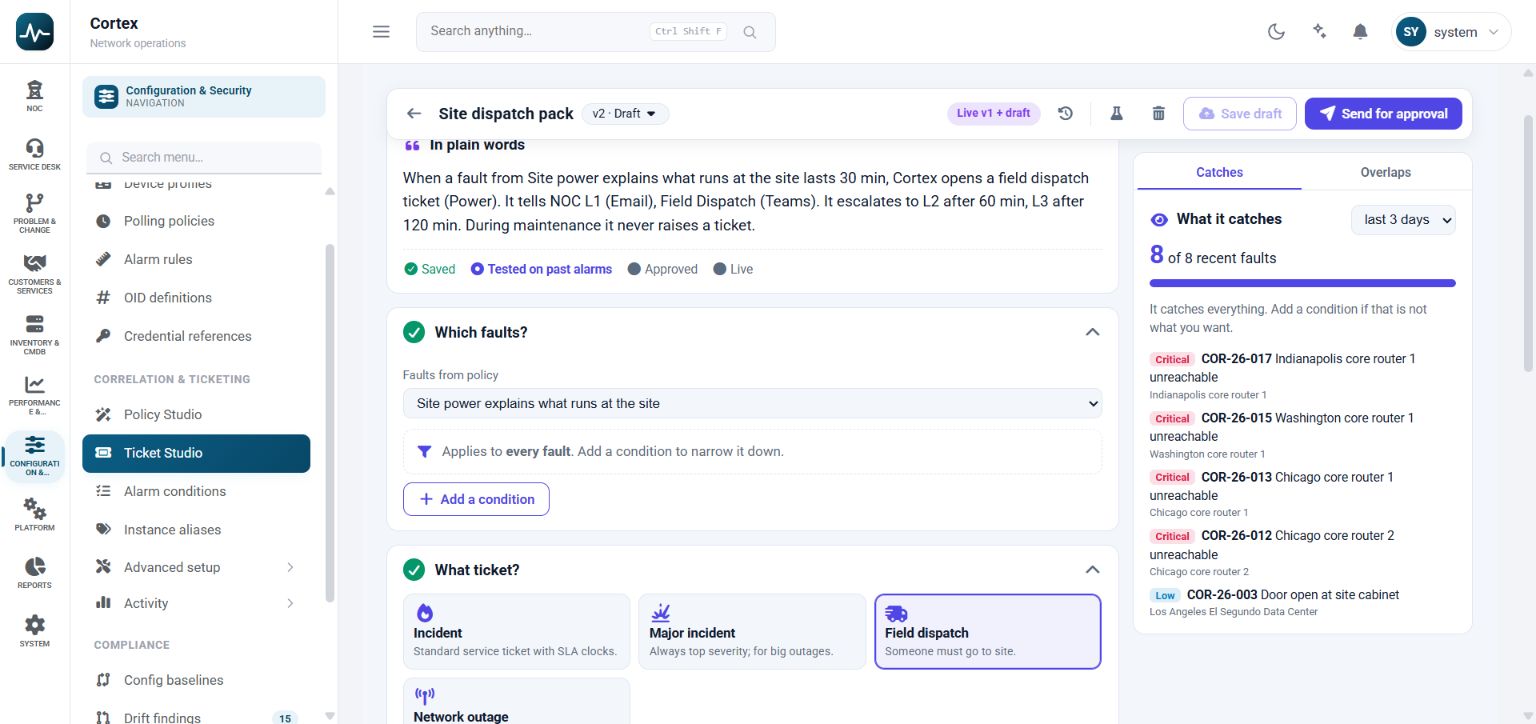
Set when a fault becomes a dispatch ticket and how it escalates.
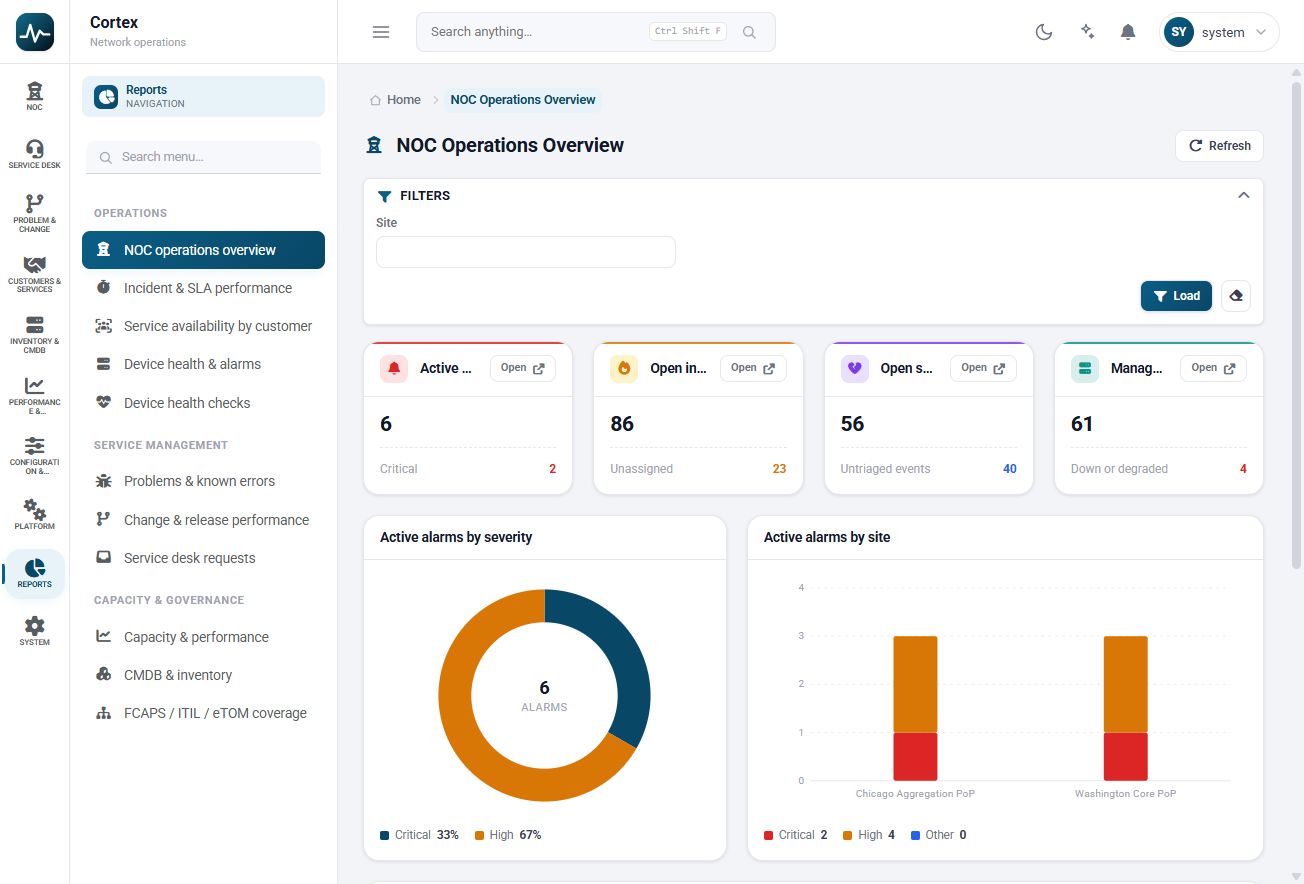
Use site filters to explore alarm severity, device health and open incidents.
Product resources
The challenge
Teams looking at Cortex usually face alarm noise, unknown impact and SLAs on spreadsheets. The alarm that matters gets lost among duplicates. Nobody can quickly say which customers a failed device affects. Response times are rebuilt afterwards, by hand. Left alone, these problems slow people down and make results harder to prove.
Alarm noise
The alarm that matters gets lost among duplicates.
Unknown impact
Nobody can quickly say which customers a failed device affects.
SLAs on spreadsheets
Response times are rebuilt afterwards, by hand.
What it does
Cortex covers NOC, Service Desk, Problem & Change, Customers & Services, Inventory & CMDB and Performance in one solution. Each capability below does a specific job, and together they follow the work from collect to prove.
NOC
Live board, network map, route trace and alarm replay.
Service Desk
Incidents, ownership and clocks in one queue.
Problem & Change
Root cause records and controlled change.
Customers & Services
Connect devices to the services they carry.
Inventory & CMDB
One record of the network estate.
Performance
Metrics, continuity and reports.
How it works
Cortex follows 5 clear steps. Collect from devices over SNMP, streaming metrics, syslog, ICMP and TCP checks. From there, work moves through each stage until the final step: keep the evidence and report on what happened.
Connect
Collect from devices over SNMP, streaming metrics, syslog, ICMP and TCP checks.
Correlate
Group related alarms and point to the probable fault.
Map impact
Trace the fault to affected services and customers.
Resolve
Run the incident through workflows with clear ownership.
Report
Keep the evidence and report on what happened.
Outcomes
The result is a clearer way of working: correlated alarms, customer impact shown, workflow-driven ownership, clocks in the platform and evidence retained. These are the changes teams should expect once Cortex is part of daily operations.
Who it's for
Cortex is designed for Operators, MSPs, NOC teams and Enterprise IT. Each group gets something different from it, as the cards below show.
Operators
Telecom carriers and ISPs.
MSPs
Managed service providers.
NOC teams
One live operating view.
Enterprise IT
Service-aware monitoring.
AI integrated
Cortex integrates with the Exceleron AI Layer, on-prem or in the cloud, using RAG for grounded answers and MCP to connect tools and data.
Before and after
What changes for your team with Cortex.
Before
- Alarm floods
- Impact found by phone calls
- Ownership unclear
- SLAs kept in spreadsheets
- Closure without evidence
With Cortex
- Correlated alarms
- Customer impact shown
- Workflow-driven ownership
- Clocks in the platform
- Evidence retained
Technology explained
These are the technologies and formats Cortex works with, explained in plain language.
- SNMP v2c
- Widely supported version of SNMP for polling device status and counters.
- Streaming metrics
- Performance readings pushed continuously from the source.
- Syslog
- Standard format that devices use to send log messages.
- ICMP
- Ping-style checks that confirm a device is reachable.
- TCP checks
- Tests that a service port is open and responding.
- Network map
- Visual view of devices, links and their current state.
- CMDB
- Configuration database recording assets and how they relate.
- Workflows
- Defined steps, approvals and owners that move work to completion.